Quantify and pool positions
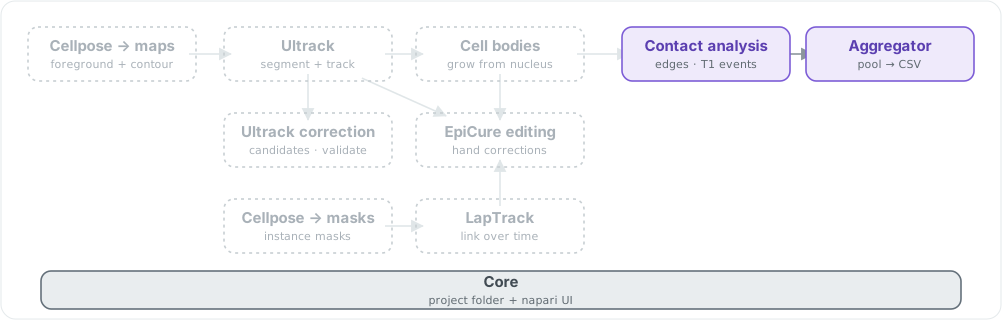
itasc-aggregate ships the measurement tail: contact analysis per position and the aggregator that pools across the project, on the shared Core. It reads tracked labels a run already committed. Solid chips are shipped; dashed are the rest of the family.
itasc-aggregate ships the measurement tail: contact analysis per position and the aggregator that pools across the project, on the shared Core. It reads tracked labels a run already committed. Solid chips are shipped; dashed are the rest of the family.
itasc-aggregate is the last two stages of the pipeline on their own: measure
the contacts in one position, then pool the results across a project. It reads
the tracked cell and nucleus labels a run already committed and turns them into
the contact graph, the shared edges between neighbors, the T1 events where
neighbors swap partners, and the project-level tables that pool all of it.
This is the full app with its middle removed. Segmentation and tracking are gone; what remains is the loop around them: finding the position folders, running contact analysis on each, and aggregating across the project. Those parts work exactly as they do in the full app, so its full-app guide is the explanation: read it for contact analysis and aggregation.
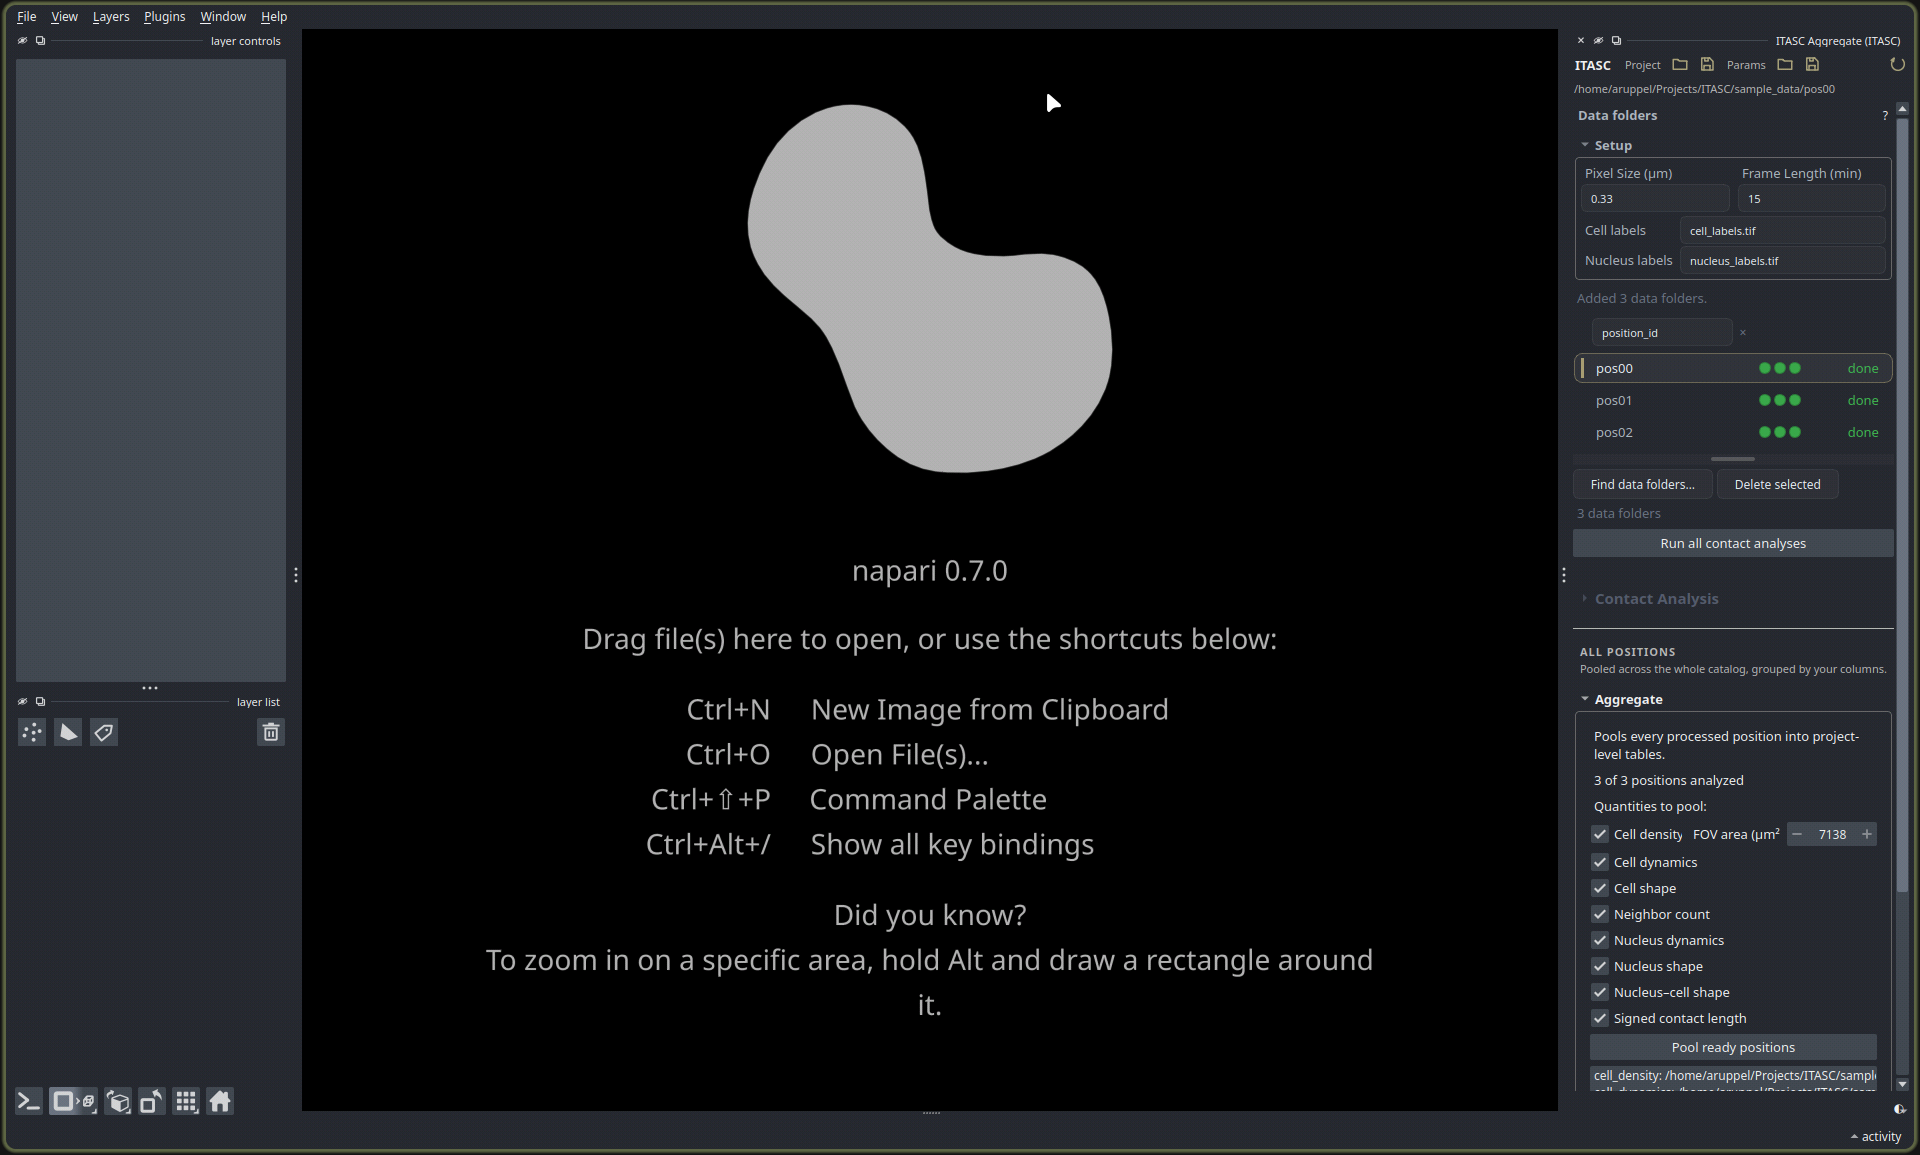
The ITASC Aggregate panel. Find data folders discovered three positions, each with a green status rail; Aggregate below pools the ticked quantities into one table per quantity.
What it needs
Point Find data folders at a parent directory, and it lists every position below it that holds any committed labels. Partial data is fine: a position may have only nucleus labels, only cell labels, or cell labels plus a contact analysis. It runs what the present labels allow and pools whatever quantities come out, so a project of unevenly finished positions still aggregates, each contributing what it has. Each position gets a status rail: click a dot to load that stage’s output into the viewer. Select a position to run or re-run its contact analysis, then Pool ready positions writes the project-level tables, one CSV per quantity, to the project root.
To try it before you have data of your own, download
itasc-sample-data.zip
(12 MB) and point Find data folders at the unzipped sample_data/ folder:
its three positions carry cell and nucleus labels, ready to measure and pool.
Install
pip install itasc-aggregate
To run it as a napari app instead of installing into your own environment, the install guide sets up napari and the tool together.
For scripting
The headless backend lives under itasc.contact_analysis, Qt-free and importable
without the full app:
from itasc.contact_analysis import ensure_contacts, discover_contact_batch_jobs, run_contact_batch

# One position (build only if missing):
ensure_contacts("cells.tif", nucleus_labels_path=None, output_path="contact_analysis.h5")

# A whole study, discovered by folder:
jobs = discover_contact_batch_jobs("/data/study", cell_name="cell_labels.tif")
run_contact_batch(jobs, overwrite=False)
The output is one self-describing HDF5 file per position, holding cells, edges,
t1_events, and provenance. The
full-app guide covers the
pipeline these stages sit at the end of.