Preparing the input maps
The tracker needs two things for every frame: a foreground map saying where the cells are, and a contour map saying where the boundaries between them run. It works from these two maps only, not from the raw microscope image directly. This stage builds them.
It runs on each channel on its own, nucleus and cell, one frame at a time, with no information carried between frames. The maps it produces feed both the nucleus tracking and the cell-body stage.
The stage is built on Cellpose, a published tool for finding cells.
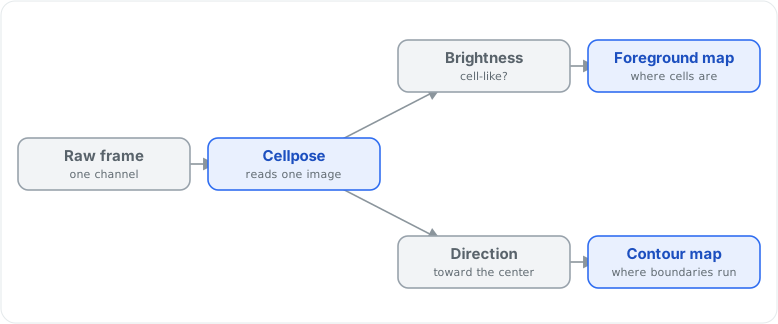
One frame in, two maps out: Cellpose reports a brightness and a direction at every point; the brightness becomes the foreground map, and the direction field becomes the contour map.
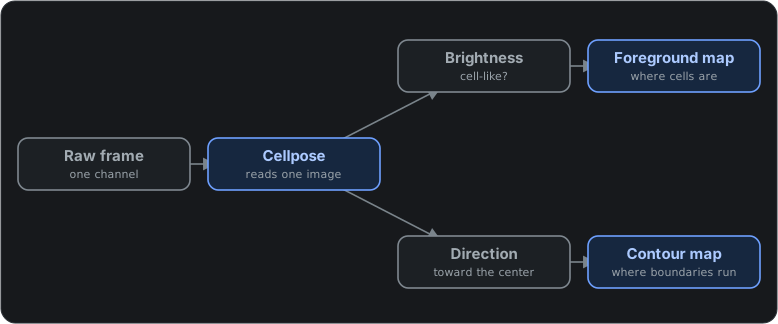
One frame in, two maps out: Cellpose reports a brightness and a direction at every point; the brightness becomes the foreground map, and the direction field becomes the contour map.
What Cellpose gives
Cellpose reads one image and reports two things at every point in it.
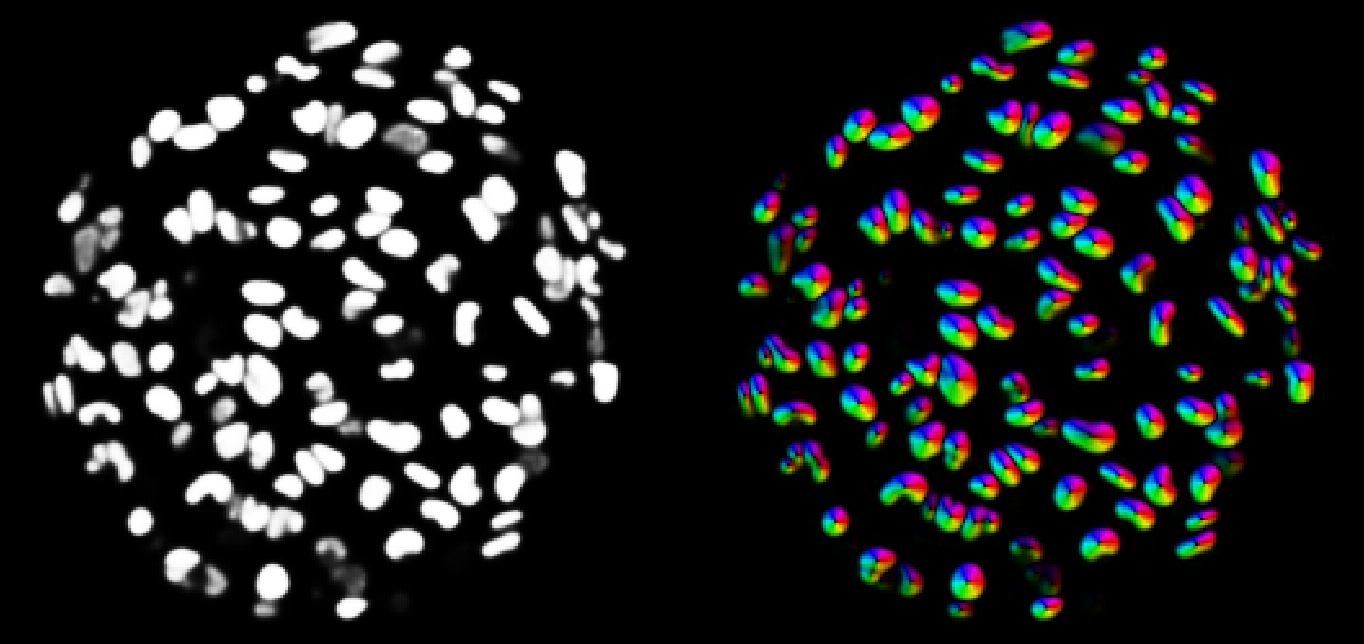
Cellpose’s two outputs, for one frame of the sample nuclei. Left, brightness: pale where a point looks like part of a cell, black where it looks like background. Right, direction: the color at each point is the direction toward the center of the cell that point belongs to, so each cell becomes a small wheel of color turning around its center.
Brightness is how cell-like each point looks: pale for cell, dark for background.
Direction is an arrow at every point, aimed at the center of the cell that point sits inside. The picture draws those arrows as colors, one color per direction, so a single cell becomes a small color wheel around its own center.
The two maps
The foreground map is the brightness map itself: pale is cell, dark is background.
The contour map comes from the directions. Inside one cell, every arrow points the same way, toward that cell’s center. Where two cells meet, the arrows on the two sides point in opposite directions, away from each other. ITASC marks every point where neighboring arrows point apart. Those points land on the line between two touching cells and form the contour map: a bright ridge on each boundary, drawn even where the brightness map shows one solid blob.
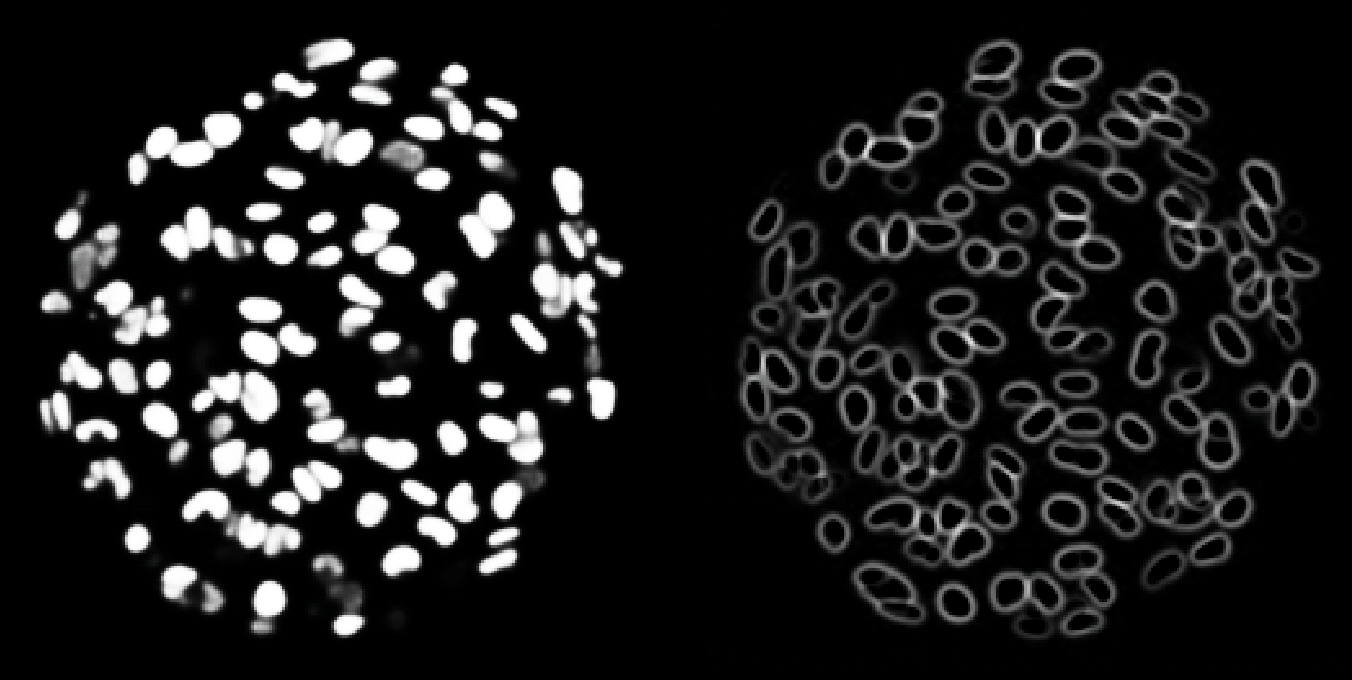
The two maps this stage produces, for the same frame. Left, the foreground map: solid where a nucleus is. Right, the contour map: a bright ring on each nucleus’s boundary. Nuclei that touch and merge into one shape on the left are split by their own rings on the right, which allows the tracker to separate them.
The tracker needs the direction field to build its candidate outlines: it cuts cells apart along the ridges of the contour map, so the ridges are where the boundary information has to be. A brighter ridge is a more likely boundary, and marking too many does no harm: spare ridges only give the tracker more candidates to choose from, which improves its results (outlining and tracking the nuclei explains why).
The direction field is noisy, so ITASC smooths it before reading the ridges, or stray specks would show up as false boundaries.
Microscopes often take a stack of images at different depths. Cellpose reports both outputs at every depth, and ITASC flattens the stack into one foreground map and one contour map before moving on.
Settings
The values below are those set for the example data and used on a first run. On your own images, the settings tied to size and depth are the parameters most likely to require adjustment.
The settings come in two groups: the ones passed to Cellpose to find the cells, and the ones that turn its output into the two maps.
Cellpose settings
If your images are flat, single-depth pictures, skip the last two.
Setting |
What it does |
Default |
|---|---|---|
Diameter |
Roughly how wide a cell is, in pixels. Left at |
|
Min size |
The smallest blob to accept as a cell. Anything smaller is dropped as speckle. Raise it to ignore dust, lower it to keep tiny cells. |
|
Gamma |
A brightness adjustment made before Cellpose processes the image. |
|
3D mode |
Read the depth stack as one solid shape instead of one depth at a time. Enabled only for cells that are to be measured as true three-dimensional volumes. |
off |
Anisotropy |
Used only with 3D mode on. How far apart the depth slices are compared with the width of one pixel, so a solid shape is not stretched or squashed. |
|
The standalone version of this stage exposes three further Cellpose settings that the full app leaves at their standard values. Leave them at their defaults unless already familiar with Cellpose.
Map settings
Setting |
What it does |
Default |
|---|---|---|
Foreground z-reduction |
How the depth slices are collapsed into the flat foreground map: |
|
Contour z-reduction |
The same choice for the contour map. |
|
Contour smoothing sigma |
How much to blur the direction field before the ridges are read, in pixels. Higher hides speckle but can blur neighboring ridges into one. |
|
Contour median radius |
A second smoothing that removes stray bright specks from the direction field, in pixels. |
|
Foreground smoothing sigma |
The same blur applied to the foreground map. Turn it up only to close small holes. |
|
Foreground median radius |
The same speckle removal applied to the foreground map. |
|
Where the maps go
The nucleus maps go to outlining and tracking the nuclei. The cell maps go to growing the cell bodies. Both stages read the foreground and the contour maps, and neither uses the raw image directly.